
Description
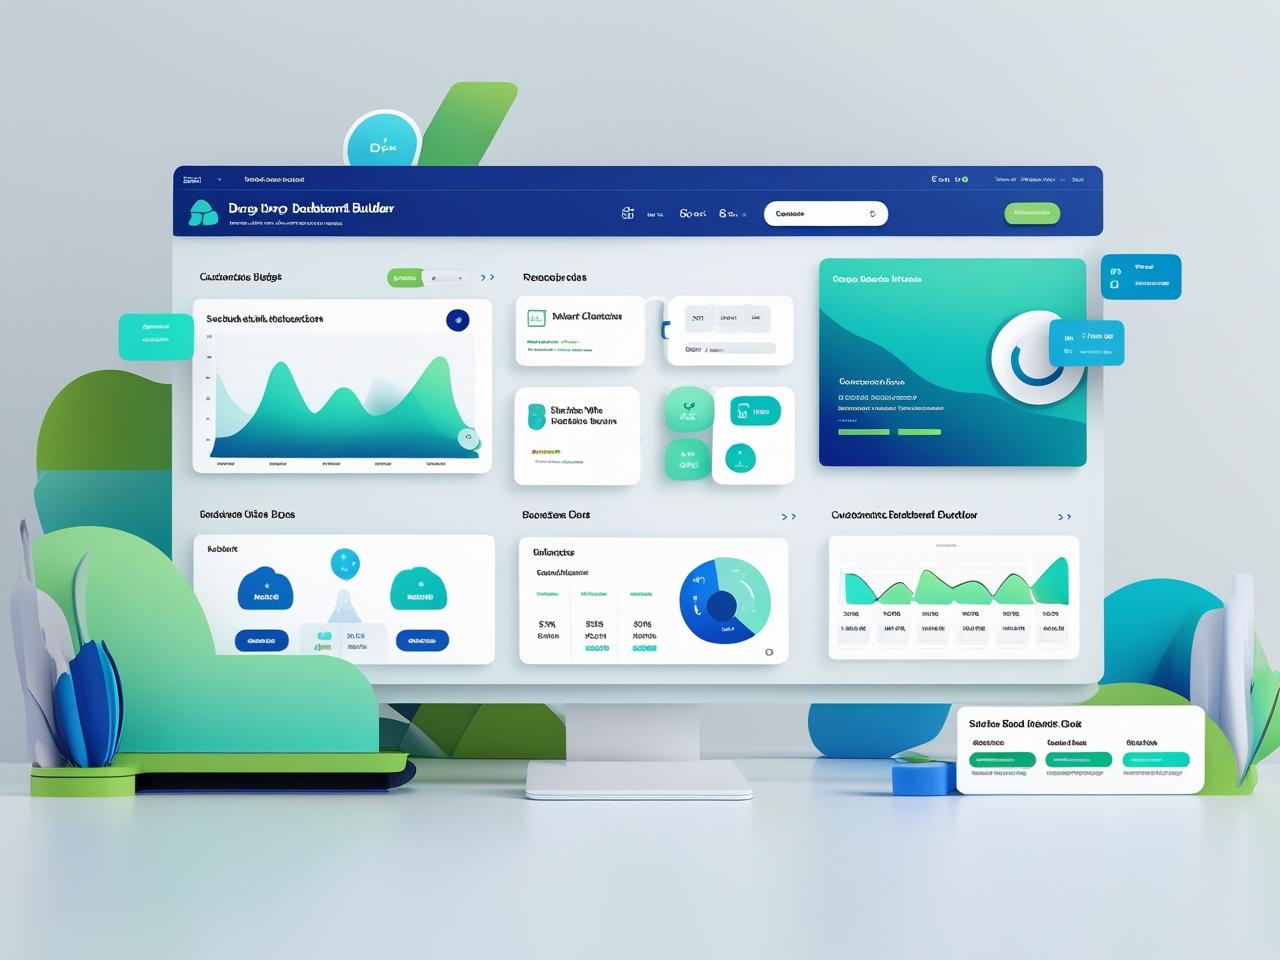
This service integrates user-friendly dashboard platforms with your existing databases, spreadsheets, or cloud services. The result: non-technical stakeholders can visually explore KPIs, business metrics, and trends with drag-and-drop simplicity. It includes template creation, data connection setup, role-based access configuration, and basic chart interactivity. Designed for teams that need real-time visibility without the complexity of code-based analytics tools.


Zayyanu –
“Integrating Drag-and-Drop Dashboard Builder Integration into our existing platform was surprisingly smooth and efficient. The functionality it provides is exactly what we needed to empower our users to create custom dashboards with ease. We’ve seen a significant increase in user engagement since implementation, and the feedback has been overwhelmingly positive. The level of control and flexibility it offers is remarkable, enabling us to cater to a wide range of reporting needs. It’s a solid addition that has improved our product offering significantly.”
Cecilia –
“Integrating the Drag-and-Drop Dashboard Builder Integration has significantly streamlined our reporting processes. The ease of use allowed our team to quickly create customized dashboards tailored to specific departmental needs, without requiring extensive coding knowledge. It’s been a huge time saver and has empowered us to visualize data in a more meaningful way, leading to better informed decision-making. The flexibility of the integration and the intuitive interface are impressive and have improved our data analysis workflow considerably.”
Success –
“We were struggling to provide our users with a customizable dashboard experience until we implemented the “Drag-and-Drop Dashboard Builder Integration”. It seamlessly integrated with our existing platform, empowering our non-technical users to create personalized dashboards with ease. The intuitive interface and robust features significantly improved user engagement and satisfaction. The integration process was smooth, and the resulting dashboards are visually appealing and functional, allowing our customers to quickly access and analyze the data most relevant to them. It’s been a valuable addition to our platform and has streamlined our data visualization capabilities.”